
Before you can do any of the following, you must create an API key to get access and install the Power BI connector which enables Power BI to fetch data from Impero.
Friendly note: We are dedicated to continuously progress in the functionality and usability of our Power BI Connector. If you had installed it before, you will see an updated set of data tables below. With this modelling approach, you are able to extract data faster and selectively extract needed data. 😊
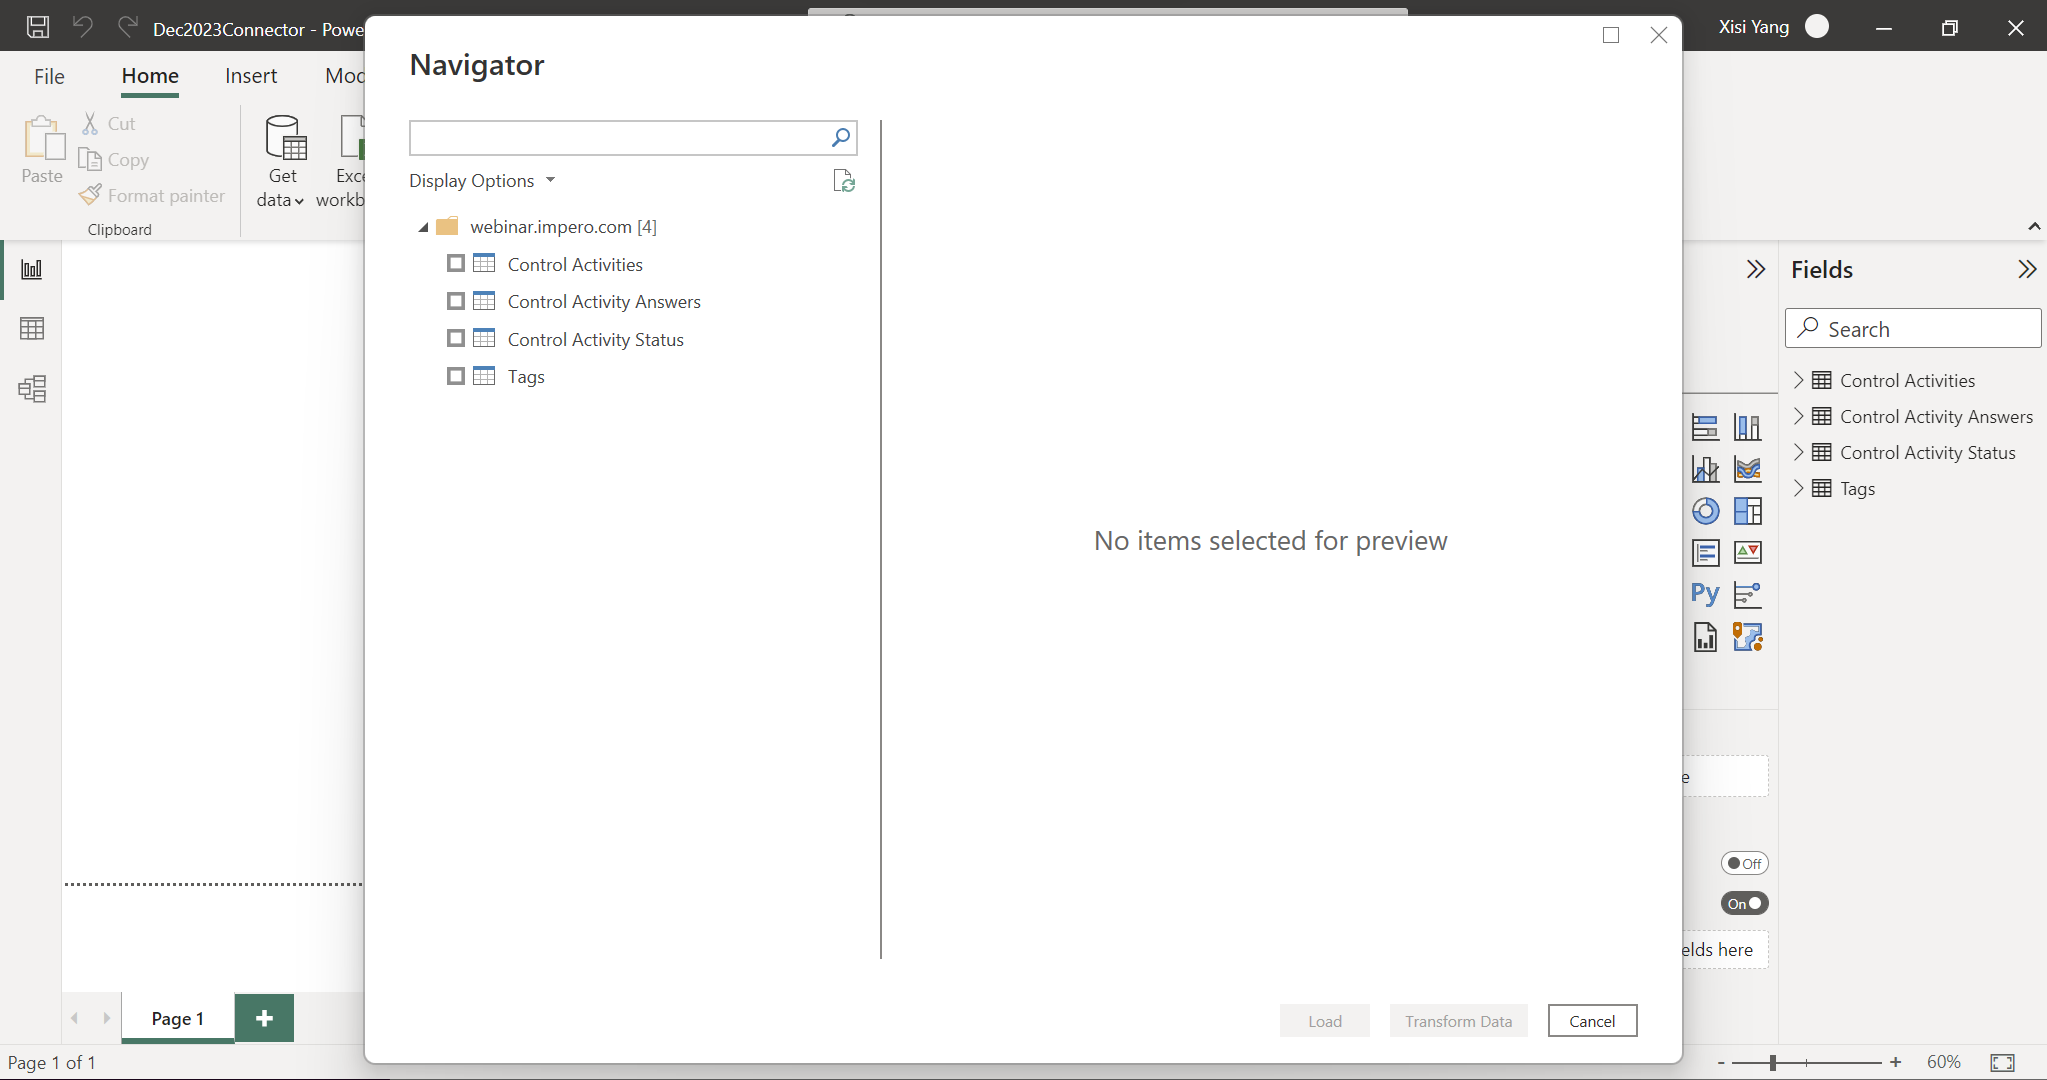
You want to import relevant data tables?
Depending on the type of report you want to create, select the relevant data tables in the Navigator. You are able to extract data for which you have access to in your Impero environment.
You only have to go through this step once. If you want to update the data, click on the "Refresh" button in the Home tab.
Tip: Which data tables are available?
Control Activities are specific control tasks that responsibles are assigned to complete for a certain control period or due to an event for their organization or business unit.
Control Activity Answers are responsibles' confirmations, comments and further types of answers submitted to complete the specific control tasks.
Control Activity Status provides the completion status of control activities and crucial time indications such as punctuality in relation with the responsible users.
Tags refer to specific control attributes that each control has been labelled with to indicate important information (e.g. frequency, entity, region) and filtering dimensions for reports.
Tip! It does not hurt to select more tables than needed, but you can always get back to this point and get more tables if needed.
You want to get an overview of your data?
Unfold "Fields" and you will see the tables you have loaded in.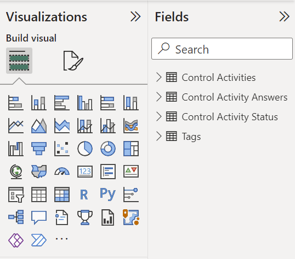
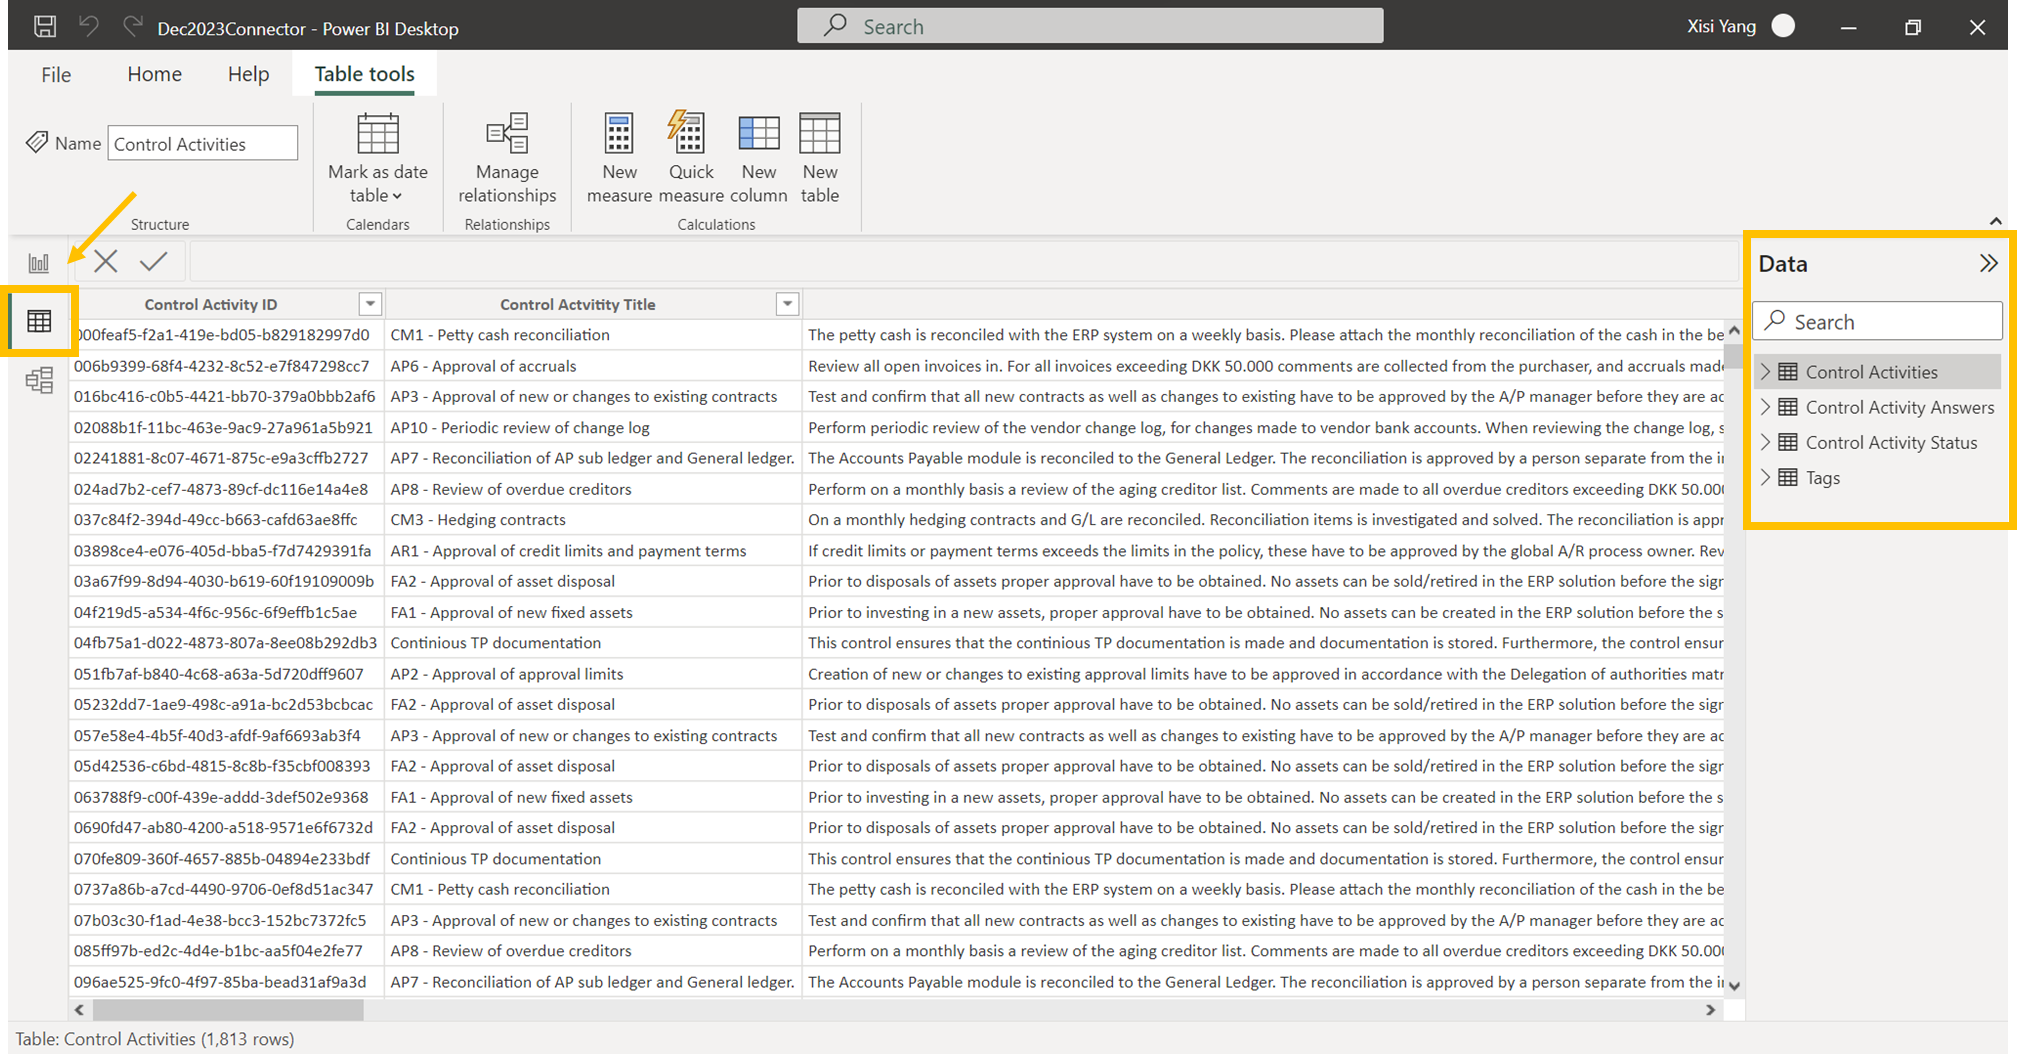
Dataview: If you want to view the data of the tables, click on the "Data" button at the left sidebar.
Relations: You can see how your data tables relate to each other. Especially, relations are important from a filtering perspective, e.g. you only want to see control results from a certain process area for the last month.
To explore the relations click on the ![]() button at the left sidebar.
button at the left sidebar.
Just a few preparation steps and you are ready to go 😊
Control status
You want to report on the control performance status: How many controls were completed on time and how many are already overdue? Establish a relationship between the tables Control Activities and Control Activity Status ID.
(Remember to turn on the audio for this video👂)
Control tags
You want to report on your control activities filtered by control attribute dimensions (e.g. control type, frequency, country)? Set cross-filter direction between the tables Tags and Control Activities.
Select active controls
Set a filter at report level to only include active and exclude archived controls by selecting "false".
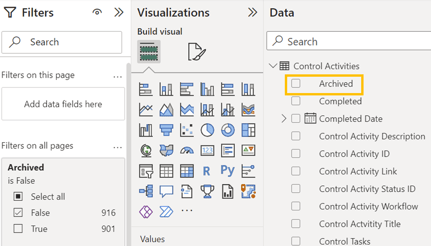
You are now ready for reporting! 👍
Cautious: Please validate your data and make sure everything is correct. If possible consult a Power BI expert in your company.