
Why should I work with Impero's Power BI integration?
You can:
- Report on live data automatically extracted from your Impero environment.
- Benefit from interactive report elements and flexible design options.
- Utilize a variety of automated & advanced visualization tools.
- Combine control reports with content outside Impero, e.g. from ERP systems or for an extensive management report.
Preparation Guide
Before you start creating your Power BI dashboard, you need to (1) create an API key in your Impero environment, (2) extract data from Impero and (3) prepare data in Power BI.
All the work is worth it, promise. 😊
Set-up Guide
Let's create a dashboard together like this! Get inspired for your individual report.
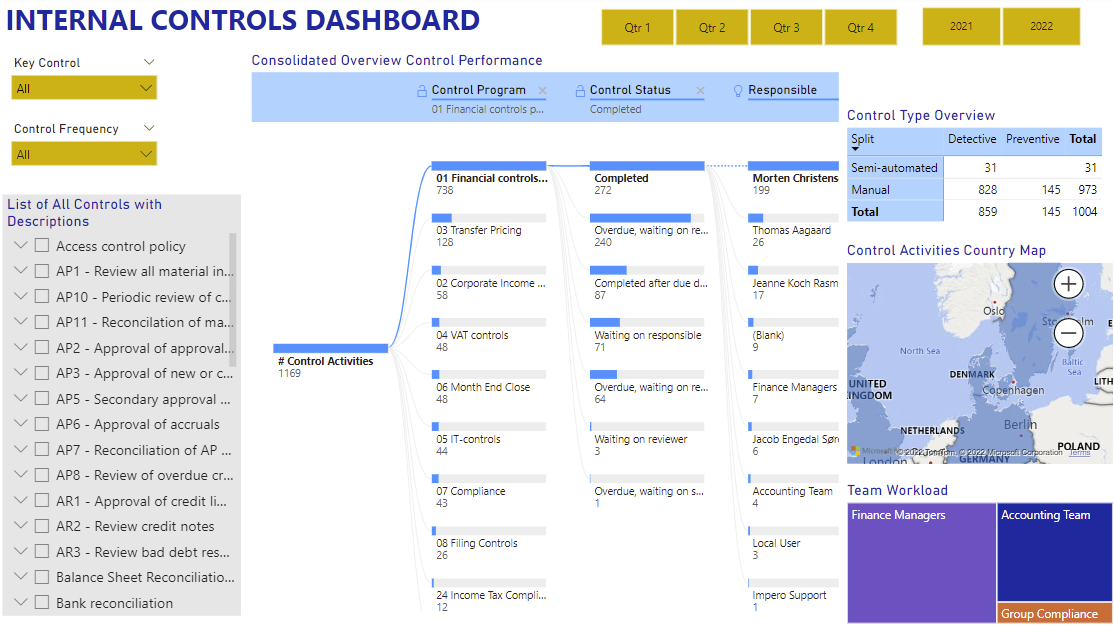
Create a consolidated overview of control performance
Demonstrate the control activities and status in your preferred structure using a decomposition tree.
Watch this video guide (turn on the audio)! 😊
Tip: Benefit from Power BI's magic 💫
- Filtering data by clicking on any element in the dashboard, e.g. to focus on completed financial controls or overdue IT controls.
- Hovering over elements to read further information
Note: The data table "Completed" under Control Activities records the number of all control activities in Impero but not completed controls!
Up for fine-tuning?
1. Clicking on ![]() under visualizations and select "General".
under visualizations and select "General".
2. Turn on "Title" and enter a text and format as you wish.
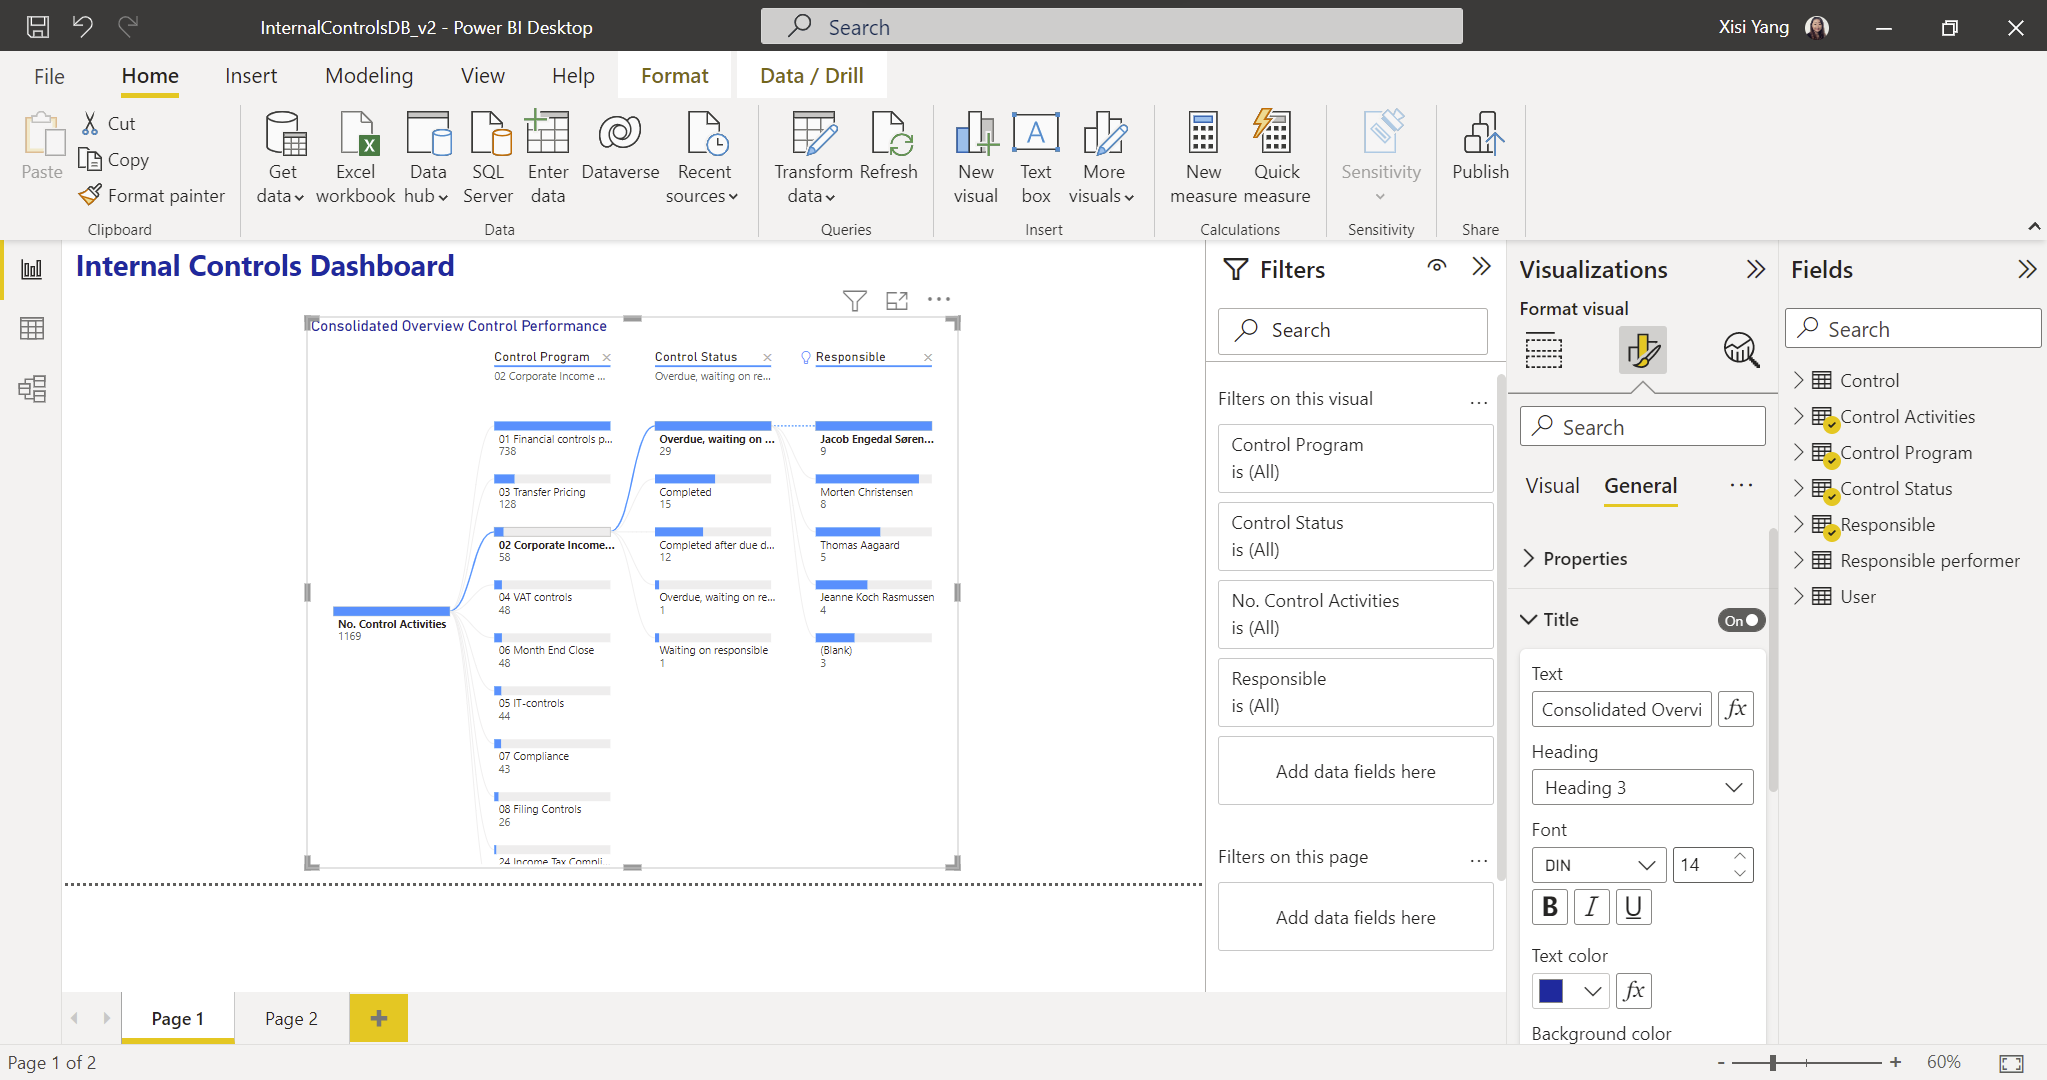
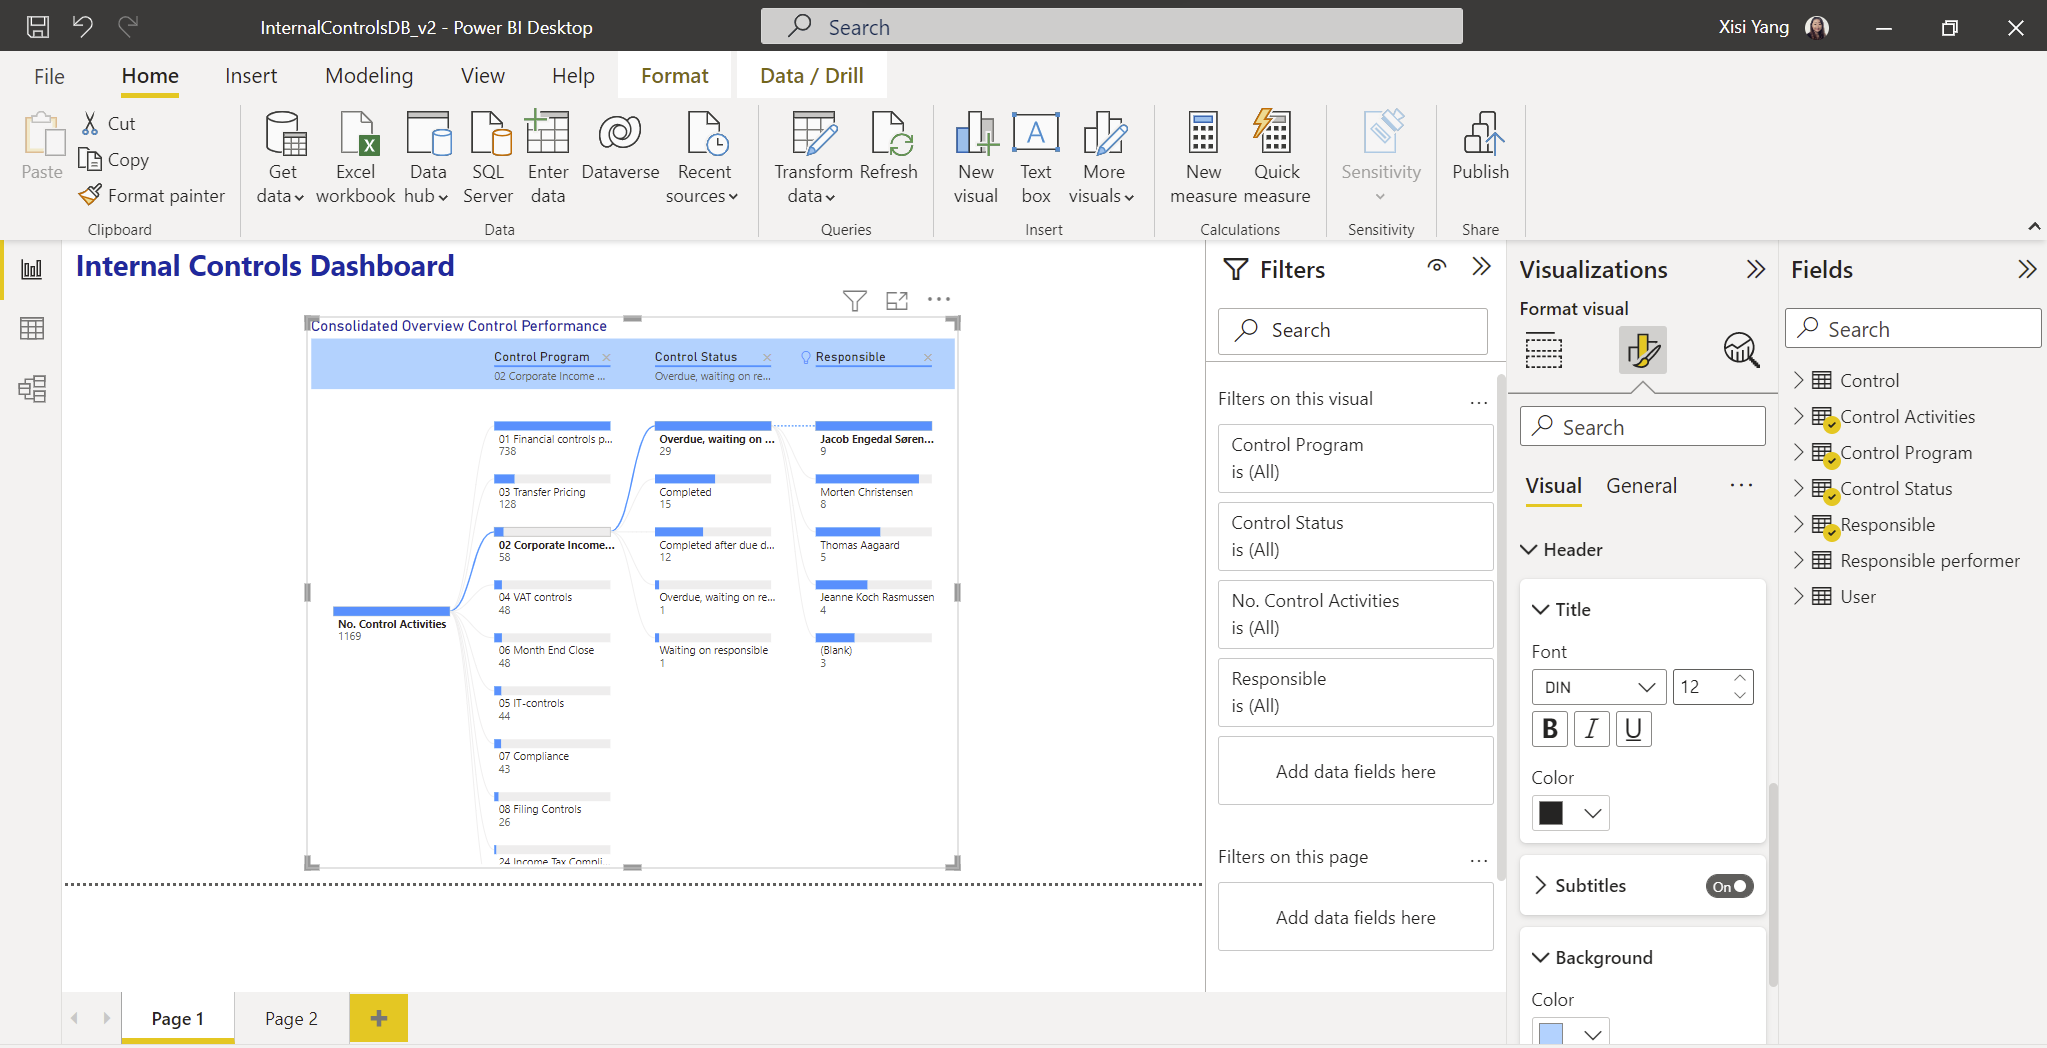
3. Change the background color of headers to e.g. light blue.
Give it a time dimension
You can add time filters using a slicer, such as the year that controls are performed for, like this:
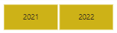
For example, by clicking on 2021, you will only see data for that year in your entire dashboard.
Learn how to:
Filter for specific control attributes
How can I only see a certain type of controls, such as key controls?
You can add a dropdown list (slicer), like this:
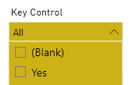
By selecting Yes, you will only see data on key controls in the entire dashboard.
Learn how to:
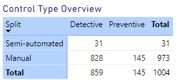
Analyze your control mix
You can create a matrix showing the number of controls by control type, like this:
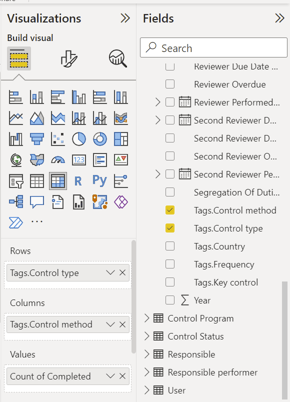
1. Click on the matrix symbol under visualizations.
2. Drag and drop the tags "control method" and "control type" to the Rows and Columns.
3. Select the number of control activities as Values by placing "Count of Completed" in the Control Activities Field.
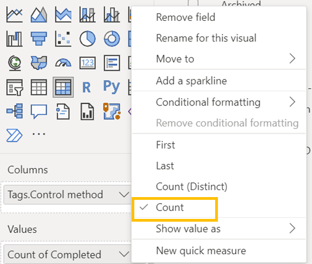
4. Change the data type to "Count" by clicking on the arrow right to "Count of Completed".
Understand your workload distribution
You can create a treemap, for example, to present the amount of controls performed by different teams:
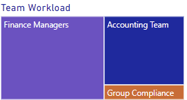
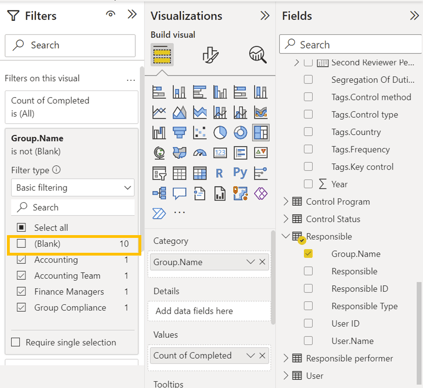
1. Click on the treemap symbol under visualizations.
2. Place group name under Category and Count of Completed under Values.
3. Exclude controls that are not performed by a user group by de-selecting the category "(Blank)".
Note: There are many more reporting options. Hopefully, you could get some ideas from this guide. For any further questions, please reach out to your Customer Success Manager or via support@impero.com.
Cautious: Please validate your data and make sure everything is correct in your report before delivery. If possible consult a Power BI expert in your company.