
Where to find the control health
Control Health lives in your Control Activities list. 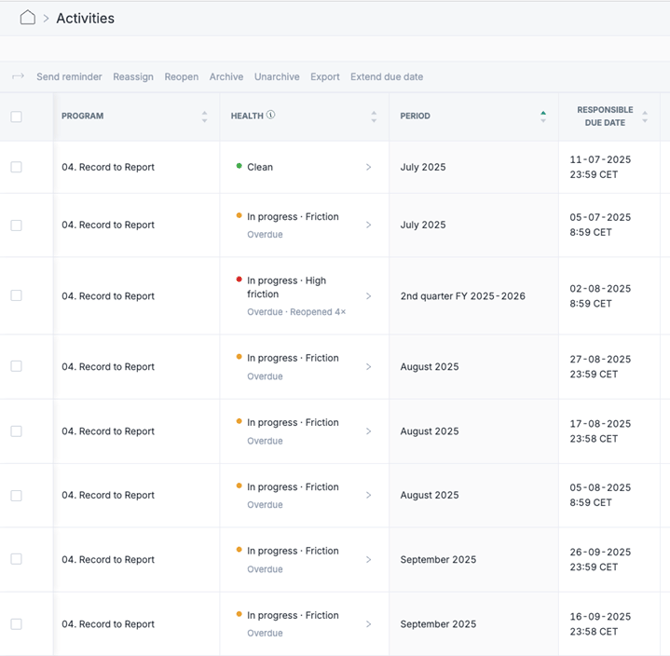
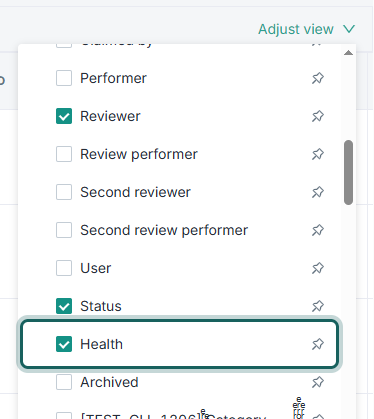
If you don't see the column already, click "Adjust view" at the top of the table and tick off the Health column.
How the control health is calculated
Control Health looks at each activity across two independent dimensions:
- Quality: Was the activity performed cleanly the first time? Rejections and reopens count as quality friction.
- Punctuality: Was the activity performed on time? Overdue or completed-late activities count as punctuality friction.
The severity level reflects how many dimensions are affected.
Note: Multiple events in the same dimension don't stack: an activity rejected three times is still Friction (one dimension), not High friction. High friction only appears when both Quality and Punctuality are affected.
How to read the control health cell
Each health cell shows two pieces of information; the severity and the reason for it.
Top line - the severity:
|
Label |
What it means |
|
🟢 Clean |
No friction. Activity is running smoothly. |
|
🟠 Friction |
One dimension is affected. |
|
🔴 High friction |
Both dimensions are affected. |
|
🔘 Pending |
Activity is still active with no friction yet. |
|
🟠 Pending · Friction |
Active + one dimension affected. |
|
🔴 Pending · High friction |
Active + both dimensions affected. |
Second line - the reason:
|
Label |
What it means |
|
Overdue |
The activity crossed its due date |
|
Rejected / Rejected 2x |
The activity was rejected during review (count shown when it happened more than once) |
|
Reopened / Reopened 2x |
The activity was reopened after completion |
|
Overdue · Rejected 2x |
Combined reasons — the activity was both overdue and rejected multiple times |
Get more details by opening the activity timeline
Click any Health cell to open the Activity timeline. This shows the full chronological history of that activity: who did what, when, and where friction happened. 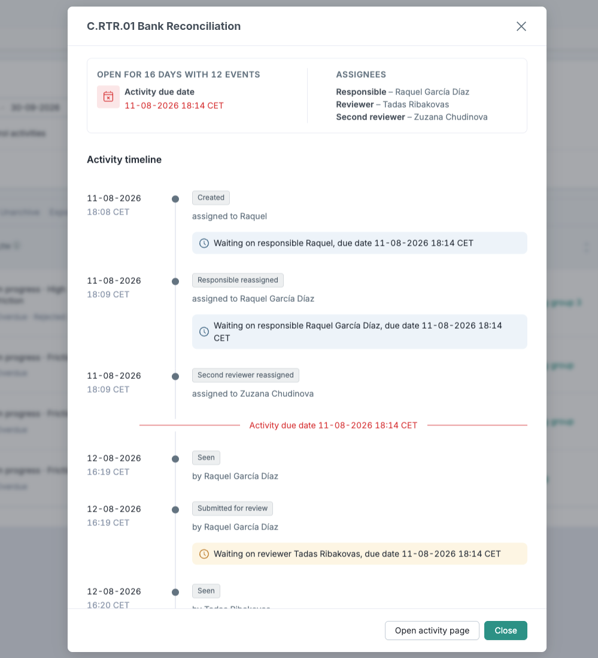
At the very top of the timeline, you see total time to complete (or total time open, if still active), amount of events, due date and user involved.
The actual timeline can show:- Created and assigned - who was assigned to what role from the start
- Seen - who has looked at the activity
-
Submitted for review - who submitted, and to whom
- Approved by reviewer / Approved by second reviewer - each review step recorded separately
- Rejected → responsible / Rejected → reviewer - shows where the activity was routed back to
- Reopened - and by whom
- Reassignments - distinct labels - Responsible reassigned, Reviewer reassigned, Second reviewer reassigned - so it's clear who took over what
- Reminded - both automatic reminders (from the schedule) and manual reminders (sent by an user)
- Completed - or Completed and reviewed if the activity had reviewers.
Filter the activity list by control health
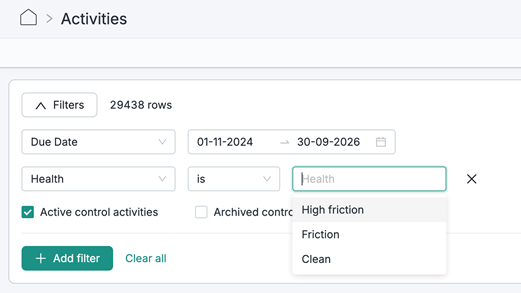
The Health column supports filtering by severity. Open the filter and choose one or more:
- Clean
- Friction
- High friction
Learn more: